995 of 38,568 SEC Filings Failed Our Balance Sheet Check
We ran one test on the balance sheets in a frozen copy of our database: does Assets = Liabilities + Equity? Of 38,568 filings we could test, 995 failed our check, about one in 39. That says something about our check. We read 20 of the 995 against the filer's own XBRL on EDGAR. In all 20 the filing balances on its own figures, and the shortfall was a line that our figures for it did not include.
What follows is the method, four charts, three of the filings in detail, and the limits of what any of it shows. The 995 filings are in a CSV, each with a link to the matching filing on EDGAR where we found one.
- 995 of 38,568. The failed filings come from 286 tickers. Another 728 filings could not be tested and are in neither count.
- 971 of the 995 carry our
missing_taglabel: the filer's own stated total agrees with its total assets, and a line on the credit side did not reach our sum. 14 are labelledroundingand 10unexplained. - 434 of the 995 are from tickers with no mapped sector, and 433 of those 434 are blank-check companies by the SIC description in our sector map. Most of the rise in the failure rate from 2024 to 2026 comes from that group, and the three years cover different quarters (see the partial-years note below).
- 20 of 20 sampled failures balance on the filer's own figures. It is a sample of 20 from 18 issuers, and it does not speak for every one of the 995.
How we counted
One frozen copy. Everything here comes from one copy of our database taken on 9 October 2026 at 17:12 UTC, so the numbers do not move while you read them. The live site will differ later, because its data and the code that reads filings both change.
The unit is a filing for one company and one period. That is a ticker and a period end, and the filing is the first one our database holds for that period, kept only if it was filed 0 to 105 days after the period ended (in this copy, 8 to 105). The rule keeps a later filing's comparative column from counting as a period of its own, and it means every figure in a row comes from one filing. 39,296 company-periods met it, from 5,764 tickers. 9,578 other company-periods with a total assets figure were left out because the first filing we hold for them was filed outside that window. Period ends run from 30 June 2024 to 5 September 2026, and the filings were filed between 1 October 2024 and 8 October 2026.
Coverage is 10-K and 10-Q periodic filings. Our database is meant to hold only those, but it also holds figures for a few foreign filers whose annual reports are 20-F or 40-F, and we have no form column for the 38,568. Of the 995 that failed, 985 match one filing on EDGAR exactly: 218 10-Ks, 766 10-Qs and one 10-KT. The other 10 are covered under "What this does not tell you" below. In two separate random draws of 150 filings that passed (300 in all), 297 were a 10-K or 10-Q and 3 were a 20-F, so the tested set holds a small share of foreign-filer reports that we have not counted exactly.
What could be tested. 38,568 filings from 5,494 tickers. The other 728 could not be: 8 report total assets of zero or less, and 720 lack a liabilities figure or an equity figure and have no stated total to fall back on. They are left out of every count and every denominator.
The test. Total assets must equal total liabilities plus total equity to within half of one percent of total assets. Equity is total equity including noncontrolling interests where the filer reports it. If the plain sum misses, we also try adding the lines that sit beside or between liabilities and equity: noncontrolling interest, temporary equity, redeemable preferred stock, redeemable noncontrolling interest and minority interest in an operating partnership. Where a filer reports equity both with and without noncontrolling interests, we also try the other figure. A filing that balances on any of those bases passes. A filer that publishes total assets and its own stated total of liabilities and equity, but no separate liabilities or equity line, is tested on that stated total instead. So 34,925 filings balanced without adding a line (5,006 of them on the stated total alone), 2,648 balanced once one of those lines was added, and 995 did not. None of the 995 was tested on a stated total alone. The full definition is on how we verify.
Failed our check means the filing landed in one of four groups. Each is our label for what the check saw, not a finding about the filer.
| Label | Failed filings | What the check saw |
|---|---|---|
missing_tag | 971 | The gap is at least one percent of total assets, and the filer's own stated total of liabilities and equity agrees with its total assets. The filing agrees with itself and the components we hold fell short, so a credit-side line did not reach our sum. |
rounding | 14 | The gap is between half of one percent and one percent of total assets. |
unexplained | 10 | The gap is at least one percent of total assets and we hold no stated total to compare with. |
broken | 0 | The filer's own stated total disagrees with its own total assets. No filing in this copy is in this group. |
Filings, not companies. A company can fail in several quarters. Counted once each, by its latest period only, 193 of the 5,839 testable companies in this copy were failing. The rest of this page counts filings.
Four charts
Each chart shows the share of tested filings that failed, and each caption gives the counts behind it. The numbers and the query for each are under the chart.
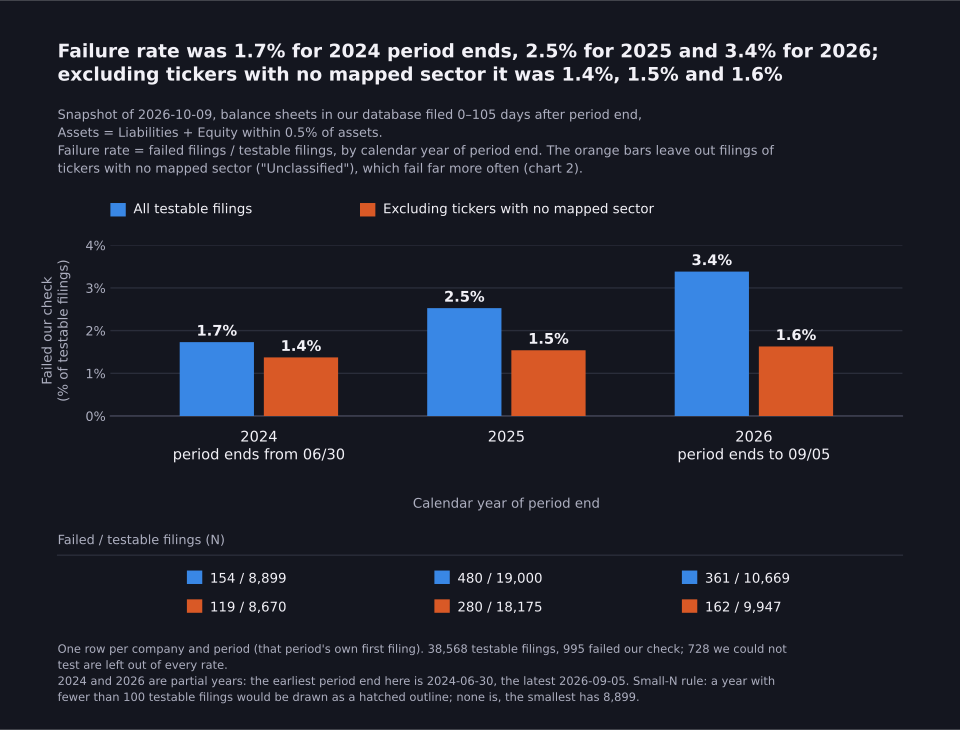
Numbers and query for the year chart
| Period end year | Tested | Failed | Tested, sector mapped | Failed, sector mapped |
|---|---|---|---|---|
| 2024 | 8,899 | 154 | 8,670 | 119 |
| 2025 | 19,000 | 480 | 18,175 | 280 |
| 2026 | 10,669 | 361 | 9,947 | 162 |
SELECT
  substr(period_end, 1, 4)                                              AS year,
  COUNT(*)                                                              AS testable,
  SUM(flagged)                                                          AS flagged,
  100.0 * SUM(flagged) / COUNT(*)                                       AS rate_pct,
  SUM(sector != 'Unclassified')                                         AS testable_named,
  SUM(CASE WHEN sector != 'Unclassified' THEN flagged ELSE 0 END)       AS flagged_named,
  100.0 * SUM(CASE WHEN sector != 'Unclassified' THEN flagged ELSE 0 END)
        / SUM(sector != 'Unclassified')                                 AS rate_named_pct,
  MIN(period_end)                                                       AS first_period_end,
  MAX(period_end)                                                       AS last_period_end
FROM filings
WHERE category != 'not_testable'
GROUP BY year
ORDER BY year;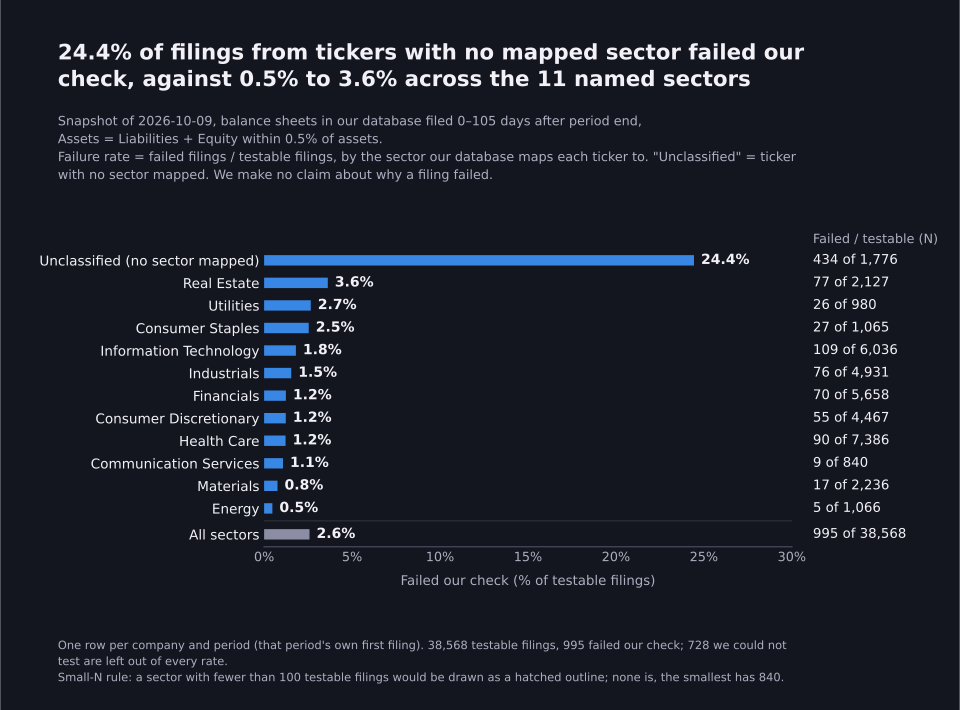
Numbers and query for the sector chart
| Sector | Tested | Failed |
|---|---|---|
| Unclassified | 1,776 | 434 |
| Real Estate | 2,127 | 77 |
| Utilities | 980 | 26 |
| Consumer Staples | 1,065 | 27 |
| Information Technology | 6,036 | 109 |
| Industrials | 4,931 | 76 |
| Financials | 5,658 | 70 |
| Consumer Discretionary | 4,467 | 55 |
| Health Care | 7,386 | 90 |
| Communication Services | 840 | 9 |
| Materials | 2,236 | 17 |
| Energy | 1,066 | 5 |
SELECT
  sector,
  COUNT(*)                          AS testable,
  SUM(flagged)                      AS flagged,
  100.0 * SUM(flagged) / COUNT(*)   AS rate_pct
FROM filings
WHERE category != 'not_testable'
GROUP BY sector
ORDER BY rate_pct DESC;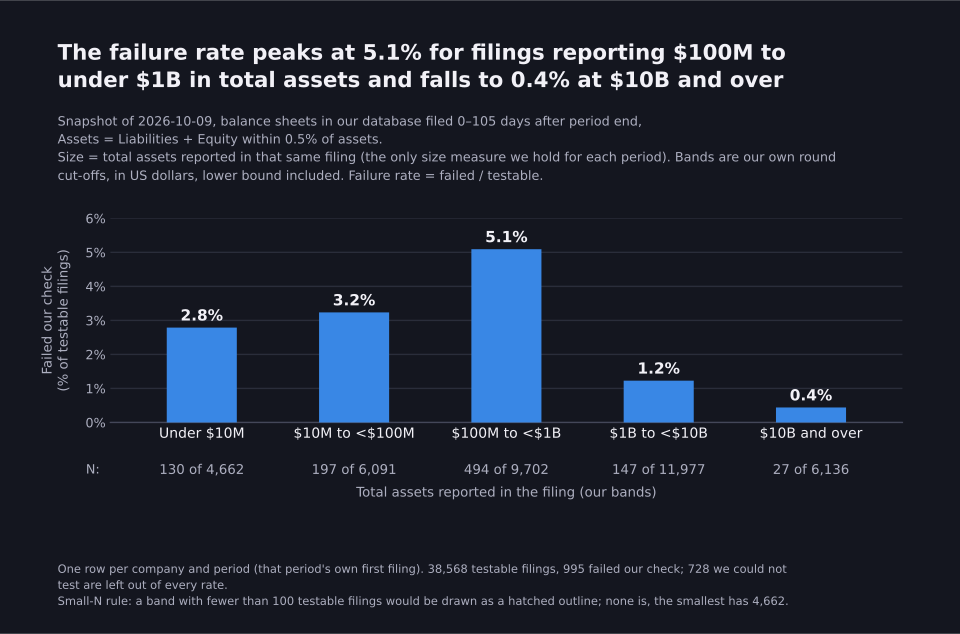
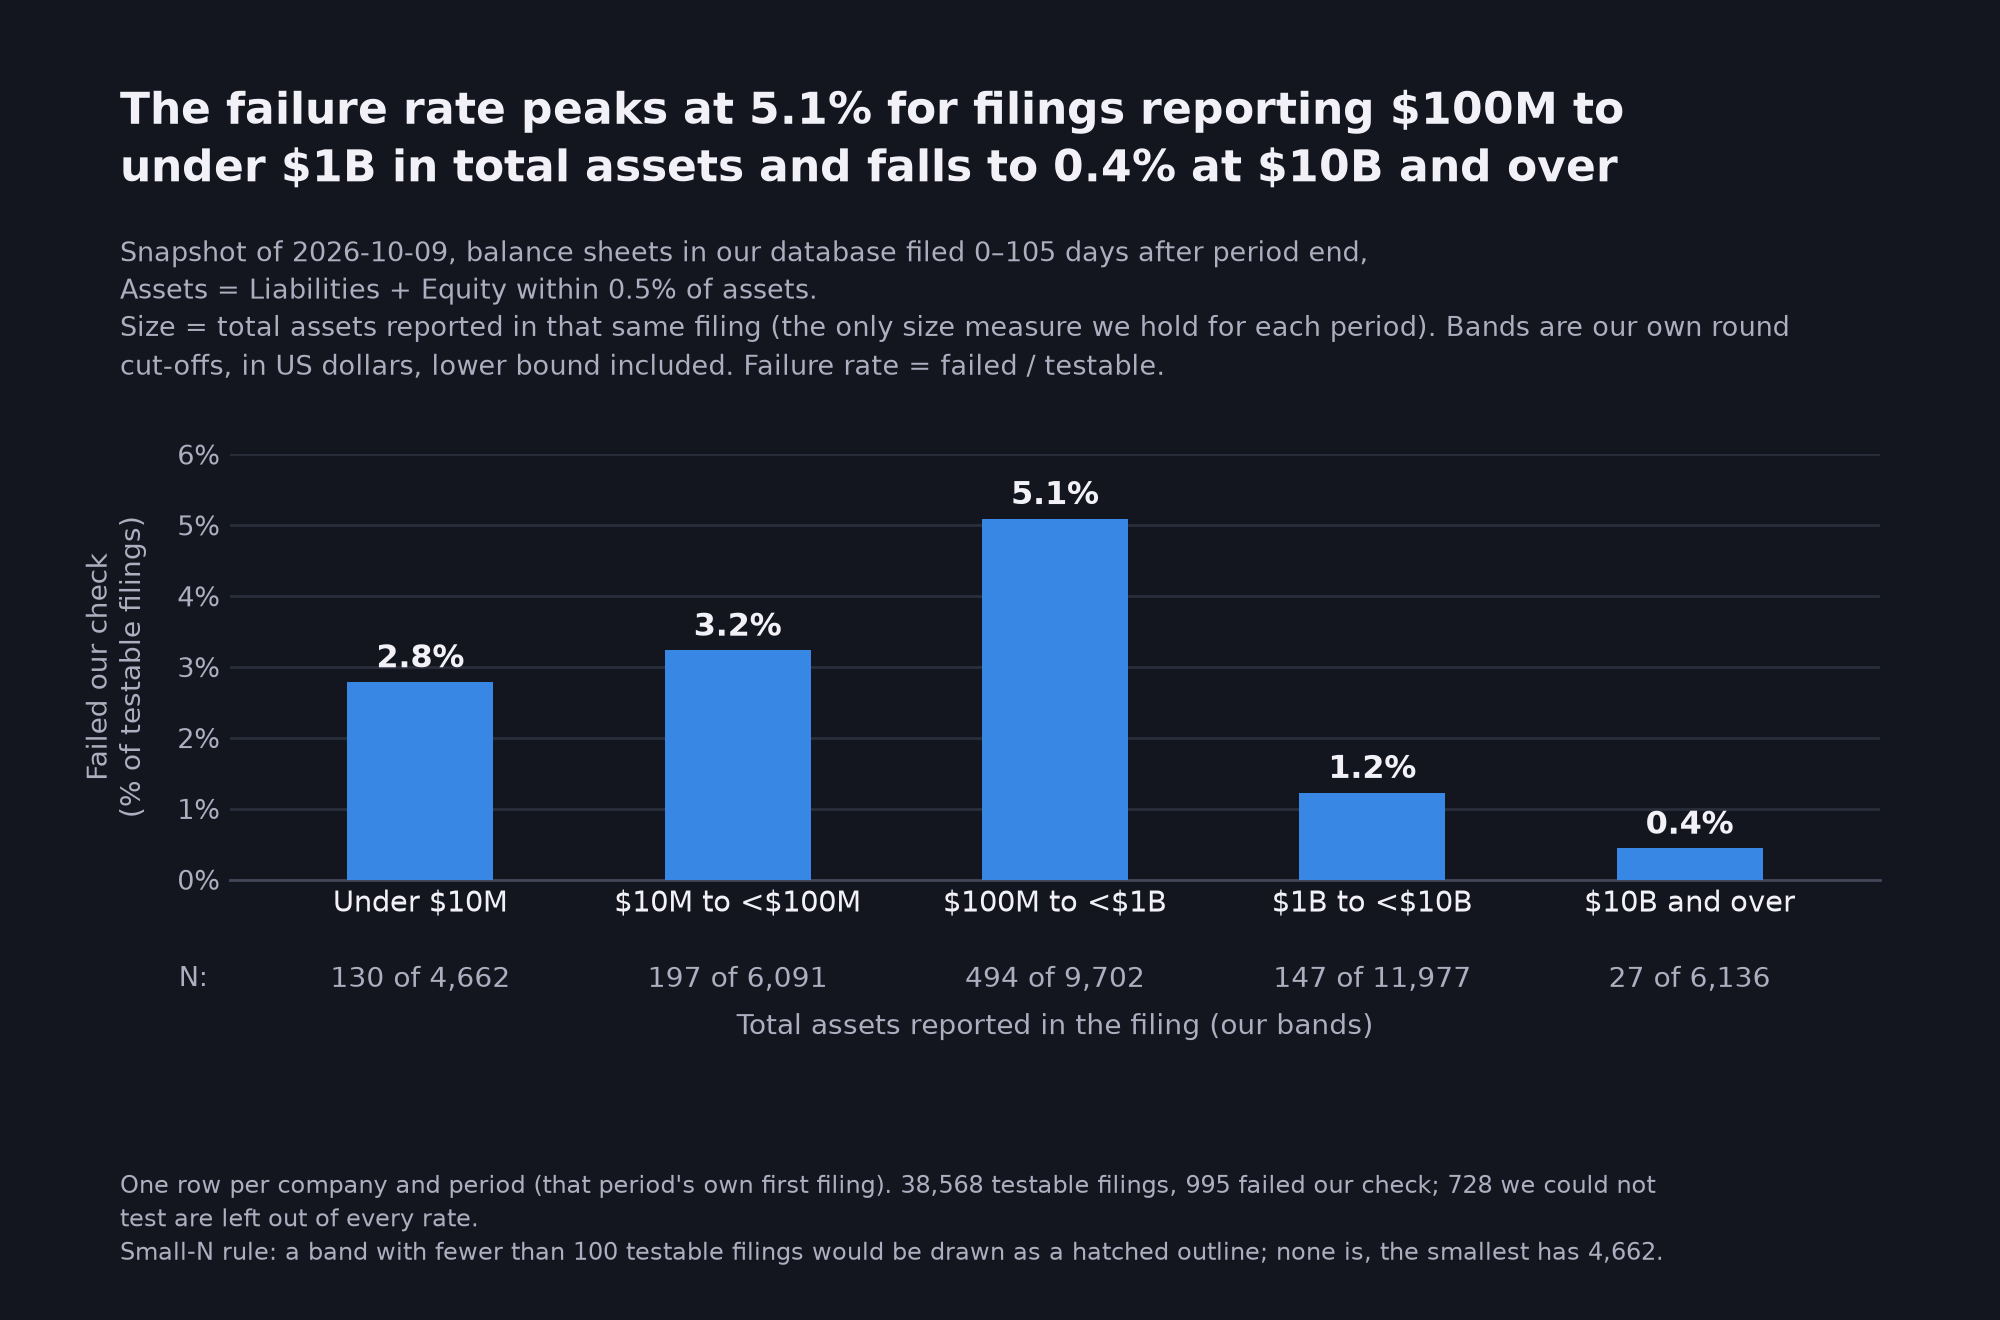
Numbers and query for the size chart
| Total assets reported | Tested | Failed |
|---|---|---|
| Under $10M | 4,662 | 130 |
| $10M to under $100M | 6,091 | 197 |
| $100M to under $1B | 9,702 | 494 |
| $1B to under $10B | 11,977 | 147 |
| $10B and over | 6,136 | 27 |
SELECT
  CASE
    WHEN total_assets <  1e7  THEN 1
    WHEN total_assets <  1e8  THEN 2
    WHEN total_assets <  1e9  THEN 3
    WHEN total_assets <  1e10 THEN 4
    ELSE 5
  END                               AS band_no,
  CASE
    WHEN total_assets <  1e7  THEN 'Under $10M'
    WHEN total_assets <  1e8  THEN '$10M to <$100M'
    WHEN total_assets <  1e9  THEN '$100M to <$1B'
    WHEN total_assets <  1e10 THEN '$1B to <$10B'
    ELSE '$10B and over'
  END                               AS band,
  COUNT(*)                          AS testable,
  SUM(flagged)                      AS flagged,
  100.0 * SUM(flagged) / COUNT(*)   AS rate_pct
FROM filings
WHERE category != 'not_testable'
GROUP BY band_no, band
ORDER BY band_no;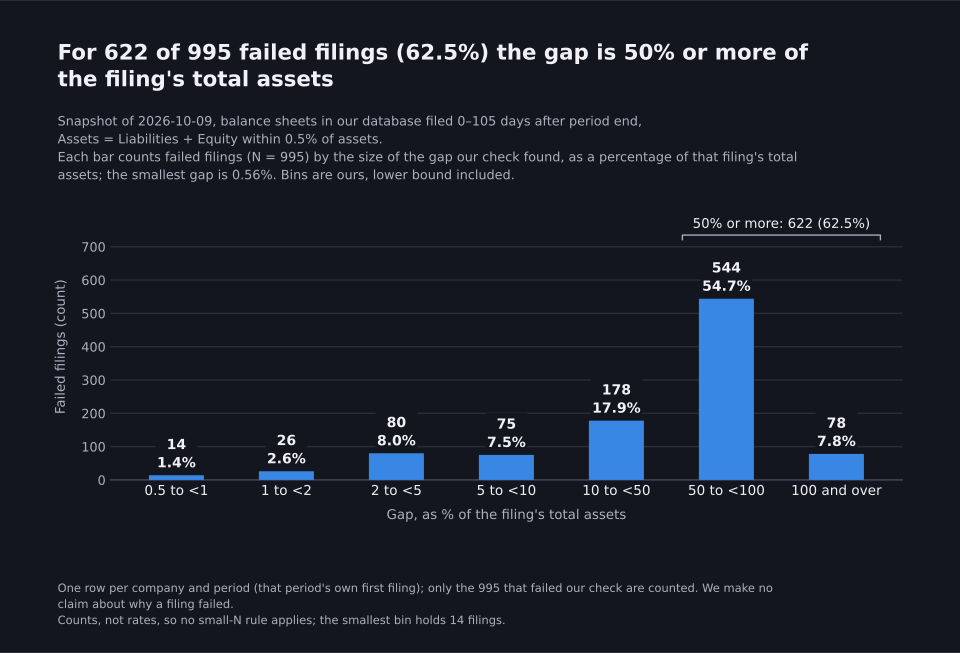
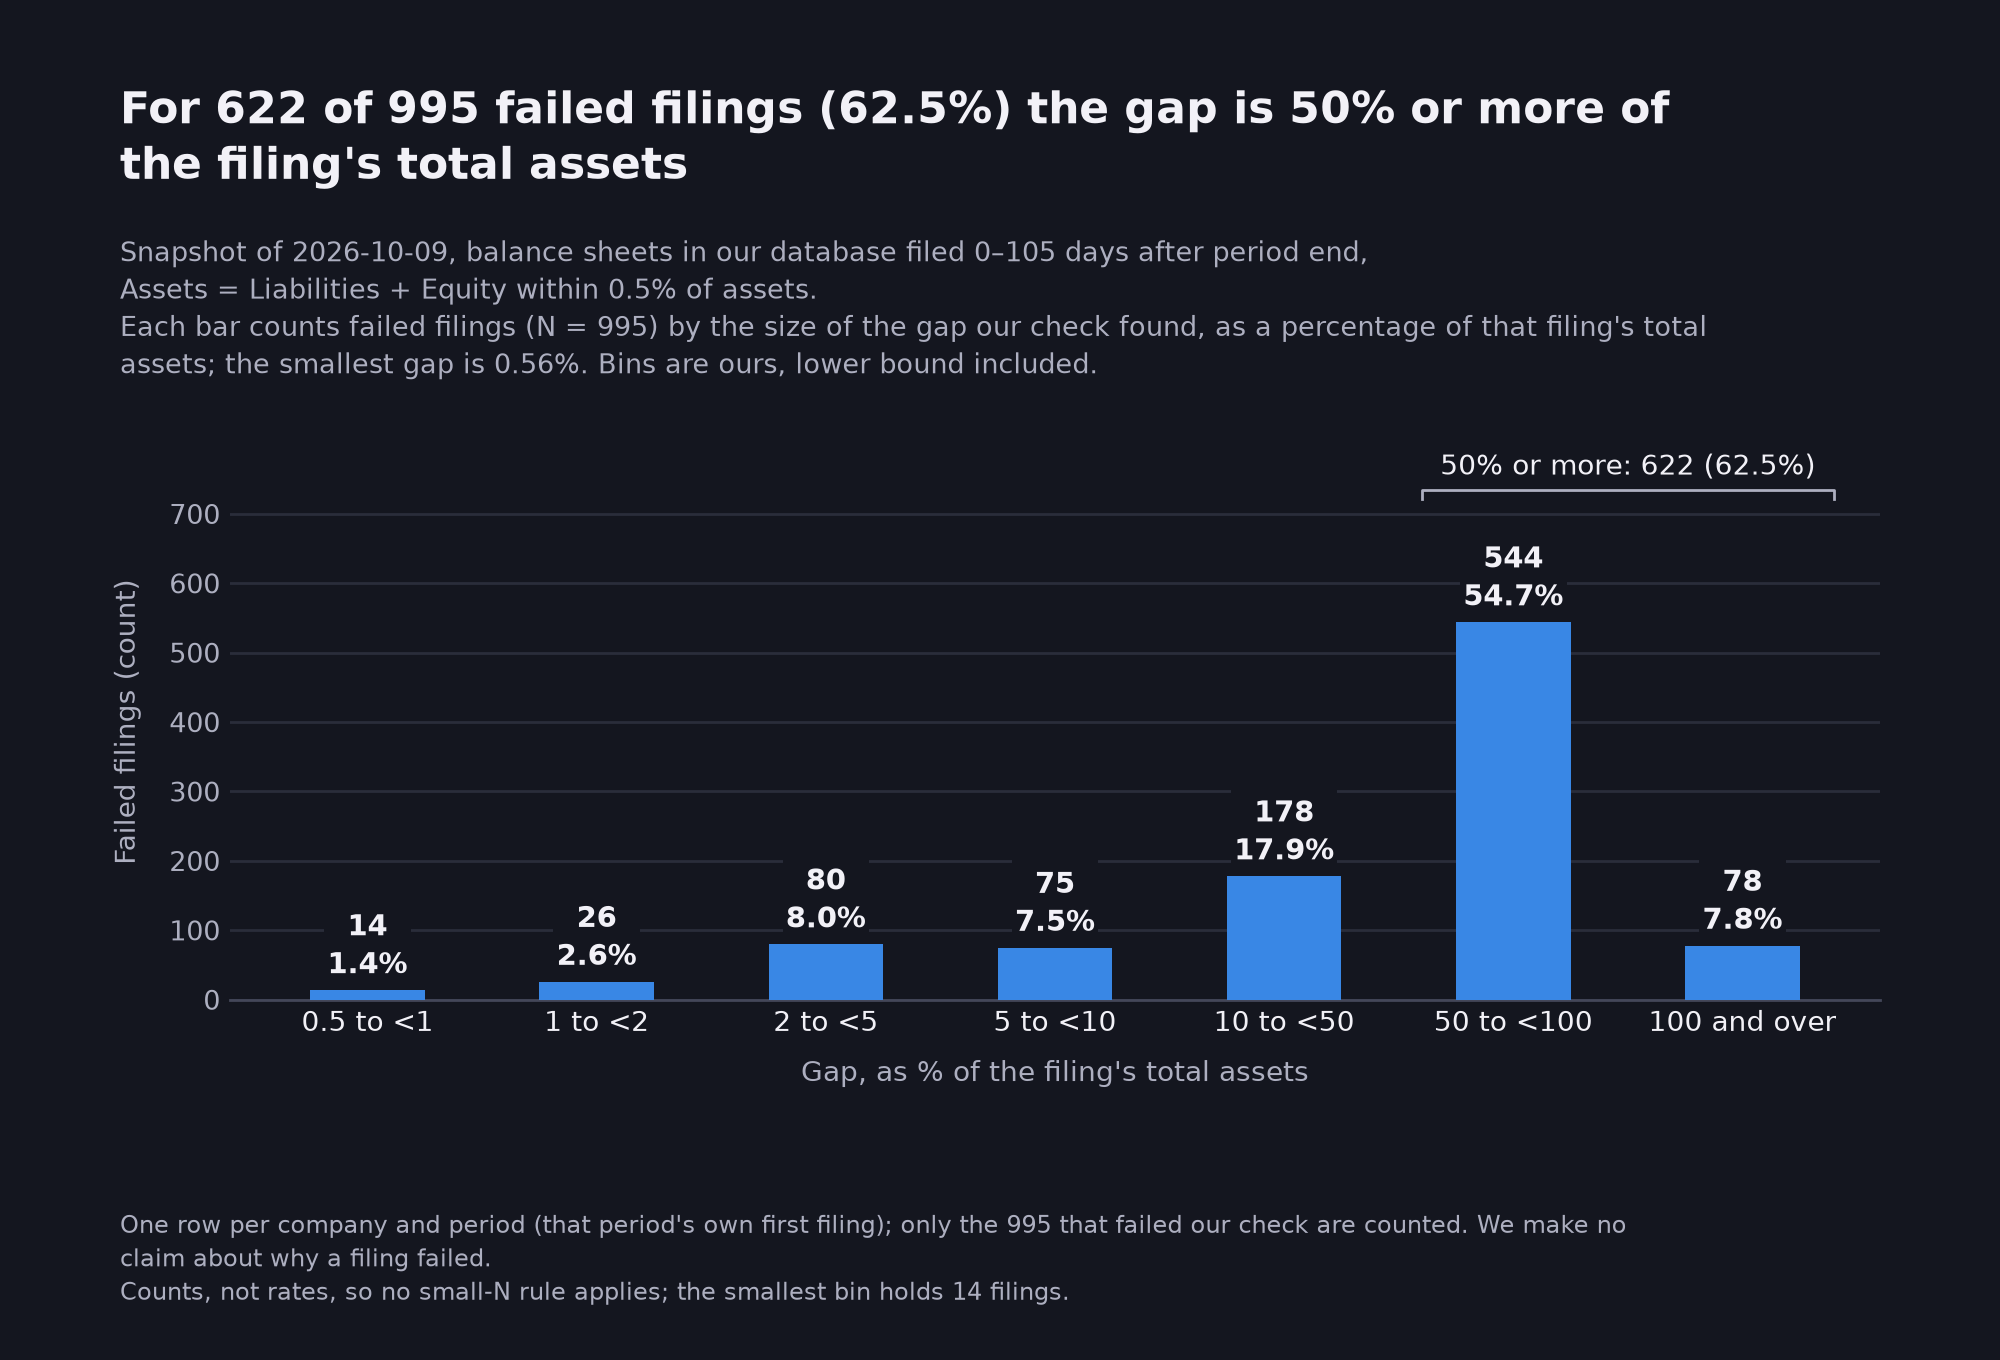
Numbers and query for the gap chart
| Gap, percent of total assets | Failed filings |
|---|---|
| 0.5 to under 1 | 14 |
| 1 to under 2 | 26 |
| 2 to under 5 | 80 |
| 5 to under 10 | 75 |
| 10 to under 50 | 178 |
| 50 to under 100 | 544 |
| 100 and over | 78 |
SELECT
  CASE
    WHEN drift_pct <   1 THEN 1
    WHEN drift_pct <   2 THEN 2
    WHEN drift_pct <   5 THEN 3
    WHEN drift_pct <  10 THEN 4
    WHEN drift_pct <  50 THEN 5
    WHEN drift_pct < 100 THEN 6
    ELSE 7
  END                               AS bin_no,
  CASE
    WHEN drift_pct <   1 THEN '0.5 to <1'
    WHEN drift_pct <   2 THEN '1 to <2'
    WHEN drift_pct <   5 THEN '2 to <5'
    WHEN drift_pct <  10 THEN '5 to <10'
    WHEN drift_pct <  50 THEN '10 to <50'
    WHEN drift_pct < 100 THEN '50 to <100'
    ELSE '100 and over'
  END                               AS bin,
  COUNT(*)                          AS flagged,
  MIN(drift_pct)                    AS min_drift,
  MAX(drift_pct)                    AS max_drift
FROM filings
WHERE flagged = 1
GROUP BY bin_no, bin
ORDER BY bin_no;
A caveat on the size chart: 1,999 of the tested filings report total assets under $1M, 287 of them under $10,000 and the smallest $1. They sit in the lowest band as filed, and we did not clean them. One of the 995 failed filings reports total assets under $10,000.
The group with no mapped sector
434 of the 995 failed filings come from tickers our sector map leaves unmapped. That group has 1,776 tested filings. It accounts for much of the pattern in the year and sector charts, so here it is in plain counts.
In our sector map, 433 of those 434 carry the SIC description "Blank Checks", the SIC category used for blank-check (special purpose acquisition) companies. The other one, CCTSF, has no SIC description and no CIK in our database. 1,309 of the 1,776 tested filings in the group are Blank Checks filings, and 433 of them failed, about one in three. Everything else, 37,259 tested filings, had 562 failures.
| Period end year | Blank Checks tested | Blank Checks failed | All other tested | All other failed |
|---|---|---|---|---|
| 2024 | 123 | 34 | 8,776 | 120 |
| 2025 | 597 | 200 | 18,403 | 280 |
| 2026 | 589 | 199 | 10,080 | 162 |
| All | 1,309 | 433 | 37,259 | 562 |
This table splits by SIC description, so its "all other" counts differ a little from the chart's "tickers with a mapped sector": the 467 unmapped filings that have no SIC description at all are in "all other" here.
The rise in the failure rate is mostly this group. It went from 34 failures in 123 tested filings in 2024 to 200 in 597 in 2025, while everything else went from 120 in 8,776 to 280 in 18,403, and to 162 in 10,080 in 2026, a partial year. Leave the group out and the share failing rises far less than the year chart shows for all filings. What we can say about why the group fails comes from the sample below: all 8 sampled filings from blank-check companies balance on the filer's own figures, and in each the line our figures missed was Class A shares subject to redemption. We have not read the other 426 failures in the group and do not claim they share that cause. The SIC description is also the one in our sector map, which is not always EDGAR's current one: EDGAR now lists a different SIC code for some of these companies, NTWO, one of the sampled ones, among them.
Three filings, read against EDGAR
We picked three filings from the sample of 20 that tell different stories. For each: the filing, what it shows, and why it failed our check. Amounts are in dollars, as in the filing's XBRL, and we checked each against the filing on EDGAR.
A blank-check company: Newbury Street II Acquisition Corp (NTWO)
The 10-Q for the period ended 30 September 2025, filed 14 November 2025, accession 0001213900-25-110889 (index). Total assets are 181,205,585. Total liabilities are 6,164,908 and the shareholders' deficit is -5,069,216. Between them sits a line the balance sheet calls Class A ordinary shares subject to possible redemption, 180,109,893. That is the amount shareholders can redeem, and it equals the cash and securities in the trust account on the asset side. The filing's own total of liabilities, Class A shares subject to redemption and shareholders' deficit is 181,205,585, equal to assets.
Without the Class A line, liabilities plus equity come to 1,095,692, a gap of
180,109,893 against total assets of 181,205,585: nearly all of them. The line is in
the filing and in its XBRL, as us-gaap
TemporaryEquityCarryingAmountAttributableToParent, but only under a
class-of-stock dimension (Class A), with no undimensioned total. Our reader keeps
facts that carry no dimensions, so the line never reached our sum. The filing
balances. Our figures for it did not.
Redeemable preferred stock: Applied Digital Corp (APLD)
The 10-Q for the period ended 31 August 2025, filed 9 October 2025, accession 0001144879-25-000069 (index). Total assets are 2,398,995,000, total liabilities 1,291,007,000 and stockholders' equity 1,044,260,000. Between the two sit Series E redeemable preferred stock of 6,932,000 and Series E-1 of 56,796,000 (Series G is nil). The statement's closing line is captioned total liabilities, temporary equity and stockholders' equity, and reads 2,398,995,000.
1,291,007,000 + 63,728,000 + 1,044,260,000 = 2,398,995,000. Our sum was short by the 63,728,000. Each series is tagged under its own class-of-stock member and the filing gives no undimensioned total, so no fact for the line reached us.
Two lines, one kept: SL Green Realty Corp (SLG)
The 10-Q for the period ended 31 March 2025, filed 1 May 2025, accession 0001040971-25-000022 (index). Total assets are 11,410,623,000, total liabilities 6,972,478,000 and total equity including noncontrolling interests 3,953,427,000. Two redeemable lines sit between them: noncontrolling interests in the operating partnership, 288,702,000, and preferred units, 196,016,000. They add to 484,718,000, and the four figures add to total assets exactly.
This one is different. Both lines are standard us-gaap tags with no dimension, and both are tags our mapping reads. Our ingest keeps one value per metric, though, and the common-units tag outranks the preferred-units tag, so we held 288,702,000 and dropped 196,016,000. Even with the first added, 196,016,000 is still missing. We class it as a gap in our own mapping rather than a tagging difference. That is a judgement call, because nothing about the filer's tagging is unusual.
Twenty failures, read against EDGAR
The three above come from a random sample. We drew 20 of the 995 with a fixed seed (20261009) over the list sorted by ticker and period end, then read each filing's XBRL and balance sheet page on EDGAR. For each we asked whether the filer's own totals agree, and where the missing line sits.
| What we found | Filings |
|---|---|
| The filer's own totals disagree with each other | 0 of 20 |
| The line is in the filing, tagged under a dimension or a custom concept that our reader does not use | 19 of 20 |
| The lines are standard and undimensioned, but we keep only one of two | 1 of 20 |
| Unclear | 0 of 20 |
In all 20, the filer's tagged total assets equal its own tagged total of liabilities and equity, and assets equal liabilities plus equity plus the credit-side line or lines we named, to the dollar. In 16 of the 20 the line was temporary equity tagged under a class-of-stock dimension: Class A shares subject to redemption at blank-check companies, or redeemable preferred stock and similar. The other four were redeemable noncontrolling interests under a different dimension (1), two custom concepts (2), and the SLG case above (1). So in every sampled case the filing balances on its own figures, and the shortfall is in how our reader handles the line. In these 20, we count the failure as ours and not the filer's. For the lines tagged under a dimension that is a judgement: the filer chose that tagging, and a reader built differently would have picked the line up.
That is a sample, and its limits matter:
- The 20 are not 20 independent companies. They are 18 issuers: NTWO and VENU each appear twice, and 8 of the 20 are filings from 7 blank-check companies.
- All 20 drawn rows carry the
missing_taglabel. The sample says nothing directly about the 14roundingor the 10unexplainedfailures. - SLG is a judgement call between a tagging difference and a gap in our mapping.
- 20 filings cannot rule out a minority of the 995 with a different cause. We do not extend the result to all 995.
- We read each original filing's XBRL and balance sheet page, not its footnotes or any later amendment.
Separately from the sample, there is a fact about the label itself. All 971
missing_tag filings have a stated total of liabilities and equity within
half of one percent of total assets: 969 equal it to the dollar and two differ by $1.
That is how the label is defined, so it is not independent evidence about the cause.
It does mean that for those 971, the filer's own stated totals agree with its total
assets. Across all 38,340 tested filings that carry a stated total, none has one
more than half of one percent away from total assets, and 23 differ at all.
What this does not tell you
- It tests the identity, not the numbers. A balance sheet can pass with a false number in it, and the check cannot see a mistake that leaves Assets = Liabilities + Equity intact, such as an amount recorded against a different asset or two offsetting mistakes. Passing is not an audit.
- Whose figures fell short. In the 20 sampled, the filer's totals agreed and the shortfall was in ours. We have not read the other 975.
- The years are not like for like. The copy holds filings made from 1 October 2024. Of the tested filings with a 2024 period end, 4,087 end in September and 4,225 in December, and only 191 end earlier. For 2026, 4,546 end in March and 4,798 in June, and the latest period end is 5 September. 2025 has all four quarters. Filings labelled full-year (FY) in our data are 4,028 of 8,899 for 2024, 4,897 of 19,000 for 2025 and 595 of 10,669 for 2026, so the mix of annual and quarterly balance sheets differs a lot between years.
- The unmapped group accounts for 434 of the 995. Read the year and sector charts with that in mind.
- Small filings. Some report total assets of a few thousand dollars or less. They are as filed and uncleaned.
- Ten rows do not match a 10-K or 10-Q exactly. Six (GLAS, MSC and YMM, two periods each) match 20-F or 40-F filings by foreign private issuers, which are outside our 10-K and 10-Q scope although our database holds figures for them; they are counted in the 995 and flagged in the CSV. One (CCTSF) has no CIK. Three (IRIX 2025-03-31, KOPN 2025-12-31 and 2026-03-31) match a filing made on the same date whose EDGAR report date is a few days before ours, which is consistent with a 52 or 53 week fiscal year. The CSV gives the candidate link and marks it as a near match.
- The 105-day rule leaves out 9,578 company-periods, whose first filing in our copy came more than 105 days after the period ended. Many are probably a prior-year column in a later filing, because our copy starts in October 2024, but we have not broken them down. They are not in any denominator.
- 728 filings were not testable and are counted as neither passes nor failures.
- Counts describe our reader on one date. If the code that reads filings changes, they will move.
Data and how to reproduce it
The CSV of the 995 failed filings has one row each: ticker, CIK, sector, period end, filing date, form and accession as EDGAR lists them, links to the filing, the figures the check used, the size of the gap and our label. A README defines every column. The charts are available as SVG and PNG from the links above.
The filings table behind the queries has one row per company and period as described under "How we counted", and its failed rows are the CSV. The denominators come from the full table, which we have not published. The tables under each chart give those counts.
The method is written out on how we verify. The balance sheet lines the check reads are available as filed from the XBRL balance sheet API, and the check itself is arithmetic on them. What a free key includes is listed on the free API page. Each company's page shows the same check on its latest period, for example NTWO, APLD and SLG.